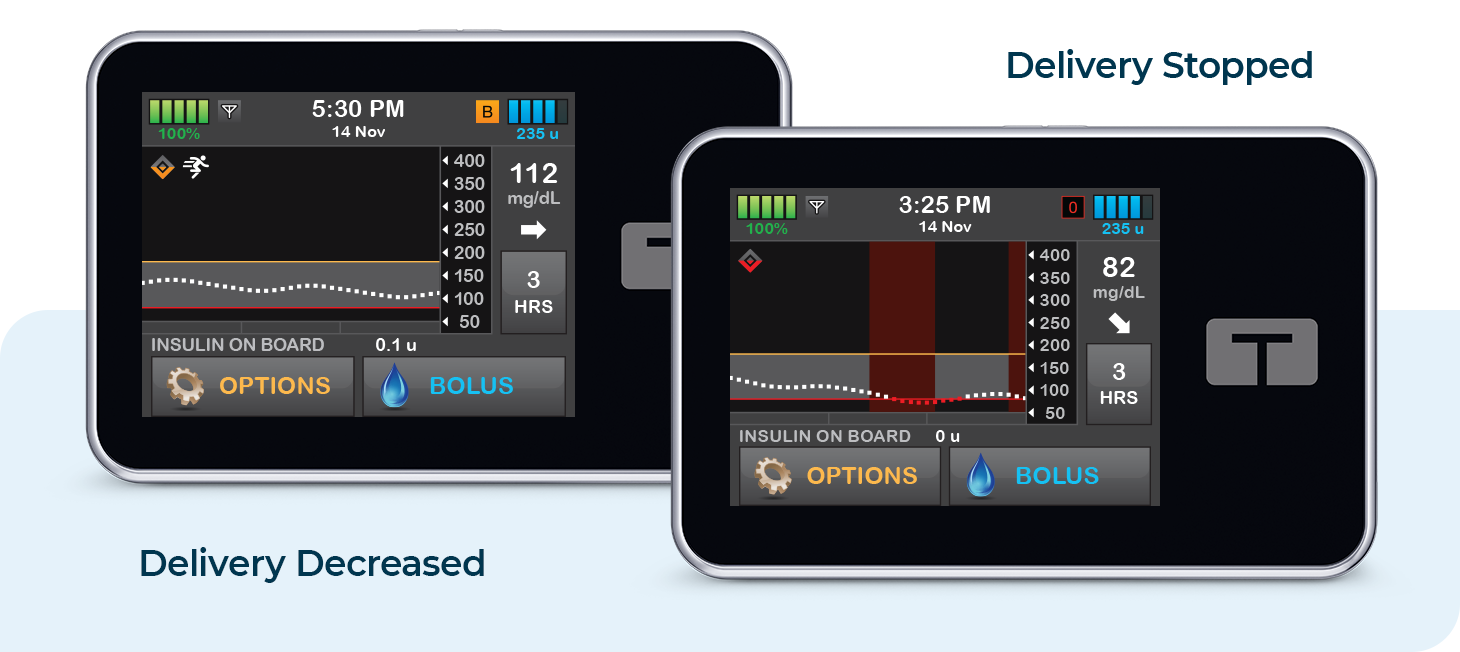
Control‑IQ technology uses CGM values* to predict glucose levels 30 minutes ahead and automatically adjust insulin delivery. For instance, it can decrease or stop basal insulin if sensor glucose is predicted to be low.
Red bars in the CGM trend graph represent periods of time when basal delivery was stopped on the t:slim X2 insulin pump. When Control-IQ technology stops basal delivery, any bolus delivery in progress will continue and new bolus delivery can be started.
Note: Periods when basal delivery was decreased do not appear with red bars in the CGM trend graph.

* CGM sold separately